Why Platt Scaling and implementation from scratch
Link to full Code in Kaggle and Github.
Platt Scaling (PS) is probably the most prevailing parametric calibration method. It aims to train a sigmoid function to map the original outputs from a classifier to calibrated probabilities.
So its simply is a form of Probability Calibration and is a way of transforming classification output into a probability distribution. For example: If you’ve got the dependent variable as 0 & 1 in the train data set, using this method you can convert it into probability.
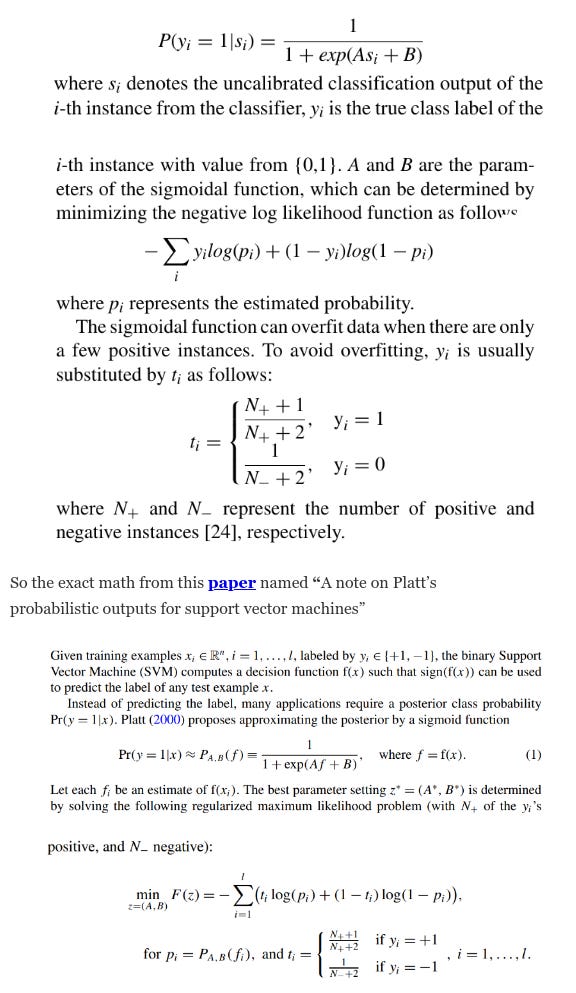
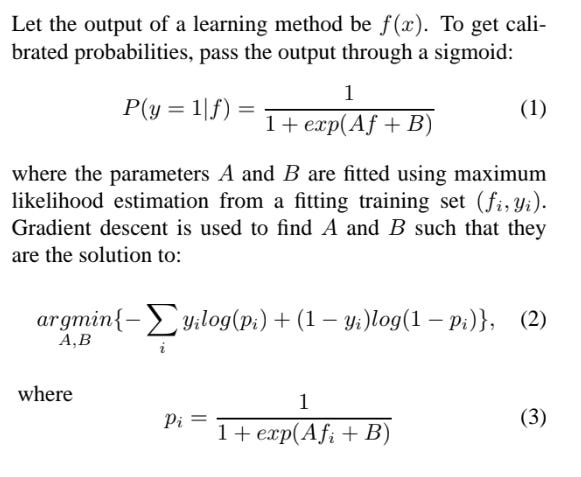
Platt Scaling is a parametric method. It was originally built to calibrate the support vector machine model and is now also applied to other classifiers. Platt Scaling uses a sigmoid function to map the outputs of a binary classifier to calibrated probabilities. The sigmoidal function of this method is defined as follows:
Why Probability Calibration
The predictions made by a predictive model sometimes need to be calibrated. Calibrated predictions may (or may not) result in an improved calibration on a reliability diagram.
Some algorithms are fit in such a way that their predicted probabilities are already calibrated, such as in logistic regression.
Other algorithms do not directly produce predictions of probabilities (most likely be uncalibrated), and instead, a prediction of probabilities must be approximated. Examples include neural networks, support vector machines, and decision trees. So the result from these algos may benefit from being modified via calibration.
Calibration of prediction probabilities is a rescaling operation that is applied after the predictions have been made by a predictive model.
There are two popular approaches to calibrating probabilities; they are the Platt Scaling and Isotonic Regression.
Platt Scaling is simpler and is suitable for reliability diagrams with the S-shape. Isotonic Regression is more complex, requires a lot more data (otherwise it may overfit), but can support reliability diagrams with different shapes (is nonparametric).
Platt Scaling is most effective when the distortion in the predicted probabilities is sigmoid-shaped. Isotonic Regression is a more powerful calibration method that can correct any monotonic distortion. Unfortunately, this extra power comes at a price. A learning curve analysis shows that Isotonic Regression is more prone to overfitting, and thus performs worse than Platt Scaling, when data is scarce.
— Predicting Good Probabilities With Supervised Learning, 2005.
More interpretations of Platt Calibration
In the case of a binary dependent variable, a logistic regression maps the predictors to the probability of occurrence of the dependent variable. Without any transformation, the probability used for training the model is either 1 (if y is positive in the training set) or 0 (if y is negative).
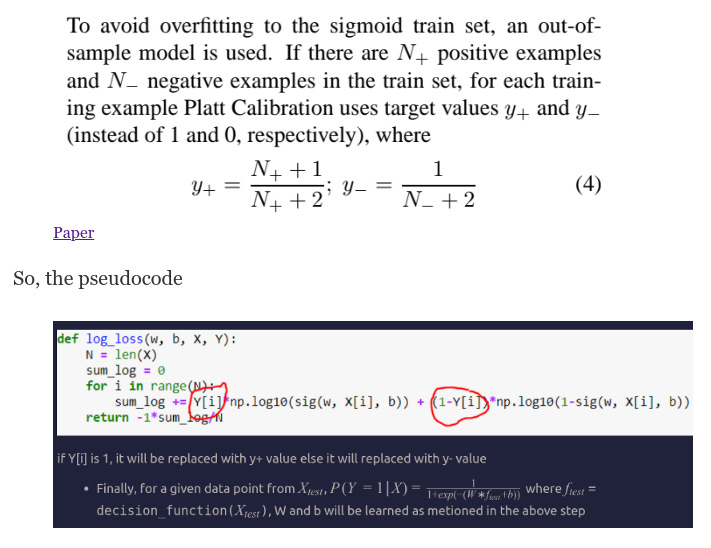
So: Instead of using the absolute values 1 for positive class and 0 for negative class when fitting
Platt suggests to use the mentioned transformation to allow the opposite label to appear with some probability. In this way, some regularization is introduced. When the size of the dataset reaches infinity, y+will become 1, and _y_− will become zero.
Methods of Platt Scaling
Refer this Paper
This paper shows that maximum margin methods, such as boosted trees and boosted stumps push probability mass away from 0 and 1 yielding a characteristic sigmoid shaped distortion in the predicted probabilities.
Models such as Naive Bayes, which make unrealistic independence assumptions, push probabilities toward 0 and 1. Other models such as neural nets and bagged trees do not have these biases and predict well-calibrated probabilities. The Paper experiments with two ways of correcting the biased probabilities predicted by some learning methods: Platt Scaling and Isotonic Regression. They qualitatively examine what kinds of distortions these calibration methods are suitable for and quantitatively examine how much data they need to be effective. The empirical results show that after calibration boosted trees, random forests, and SVMs predict the best probabilities.
From this Paper
Two questions arise: where does the sigmoid train set come from? and how to avoid overfitting to this training set? If we use the same data set that was used to train the model
we want to calibrate, we introduce unwanted bias. For example, if the model learns to discriminate the train set perfectly and orders all the negative examples before the positive examples, then the sigmoid transformation will output just a 0,1 function. So we need to use an independent calibration set in order to get good posterior probabilities. This, however, is not a draw back, since the same set can be used for model and parameter selection.
The MOST IMPORTANT Point above is — if Y[i] is 1, it will be replaced with y+ value else it will be replaced with y- value
Hence, we have to change the values of y_test as mentioned in the above image. we will calculate y+, y- based on data points in train data
Implementation from Scratch
And Finally the Trainer Function
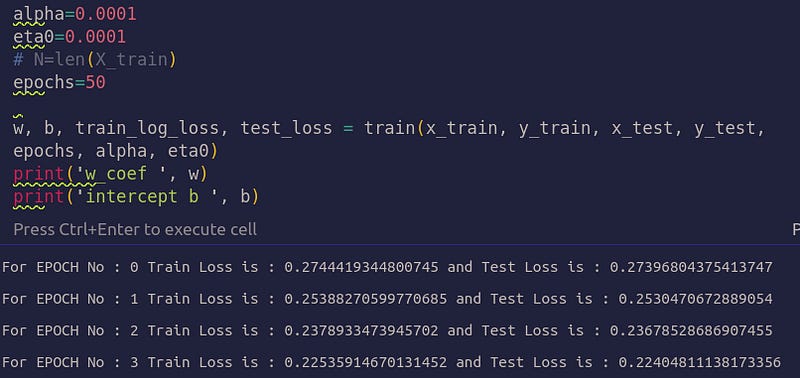
Now run the training
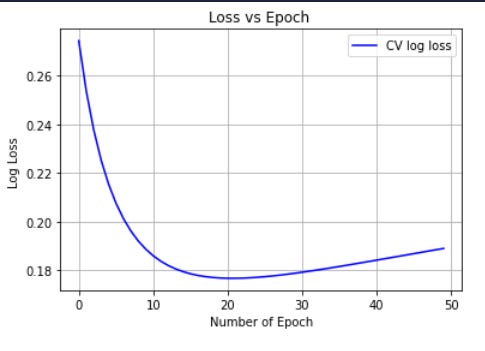
Plot the graph
x = np.array([i for i in **_range_**(0, 50)])

train_log_loss_arr = np.array(train_log_loss)

plt.plot(x, train_log_loss_arr, **"**-b**"**, label = **'**Train log loss**'**)

plt.legend(loc=**"**upper right**"**)

plt.grid()

plt.xlabel(**'**Number of Epoch**'**)

plt.ylabel(**'**Log Loss **'**)

plt.title(**'**Loss vs Epoch **'**)

plt.show()
Link to Original Paper of Platt Scaling.


